De potentie tot zware buien is in de VS 4x zo groot als in Europa
Dat is de conclusie waar onderzoekers tot kwamen bij een grote vergelijking tussen Europa en de VS. Het levert een schat aan informatie en kaarten op voor ons om te bekijken.Vertaalhulp:Bronvermelding:
Link naar volledig onderzoek: https://doi.org/10.1175/JCLI-D-20-0345.1
Link naar samenvatting SevereweatherEU: severe-storms-environment-united-states-europe-swe/
Auteurs: Mateusz Taszarek, John T. Allen, Pieter Groenemeijer, Roger Edwards, Harold E. Brooks, Vanna Chmielewski, and Sven-Erik Enno (o.a. bekende namen van Estofex)
Citation: Journal of Climate 33, 23; 10.1175/JCLI-D-20-0345.1
Annual = jaarlijks
Nocturnal = nachtelijk
Spatial smoother = interpolatie om van punten een volledige kaart te maken.
Ik raad het aan iedereen die een uurtje tijd vrij heeft, om even het onderzoek of de samenvatting van Severeweather door te lezen. Het geeft een heel interessant beeld hoe veel onweer Nederland krijgt per seizoen, in vergelijking met Europa of de VS.
Verder verstaan ze onder tornado's ook zwakke Nederlandse windhozen, dus daarom zijn wij ook een beetje de "tornado alley" van Europa.
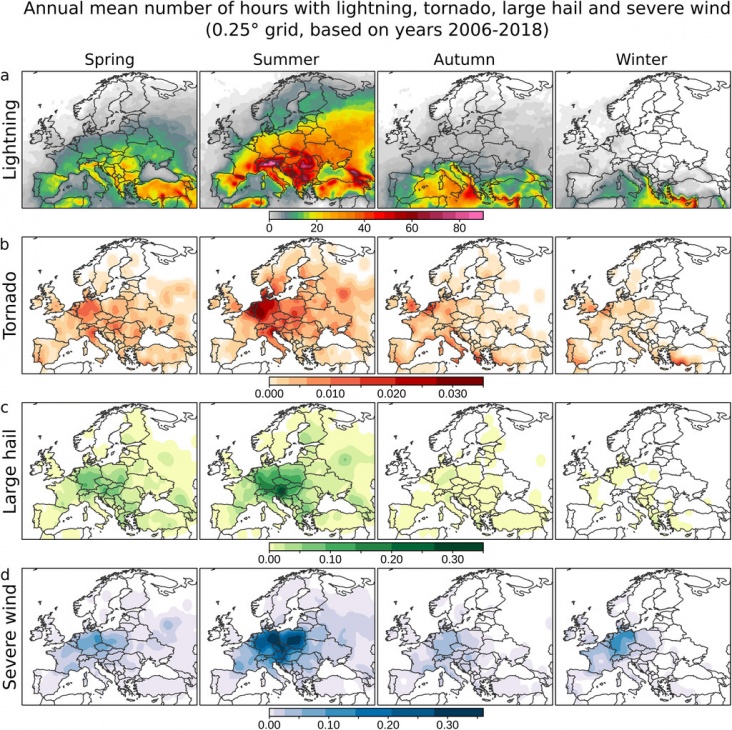
Annual mean number of hours with (a) lightning, (b) tornadoes, (c) large hail, and (d) severe wind within 0.25° boxes with a 1.25° × 1.25° spatial smoother over Europe for years 2006–18. Duplicated records (more than one report of the same type occurring in the same box and date) were not taken into account.
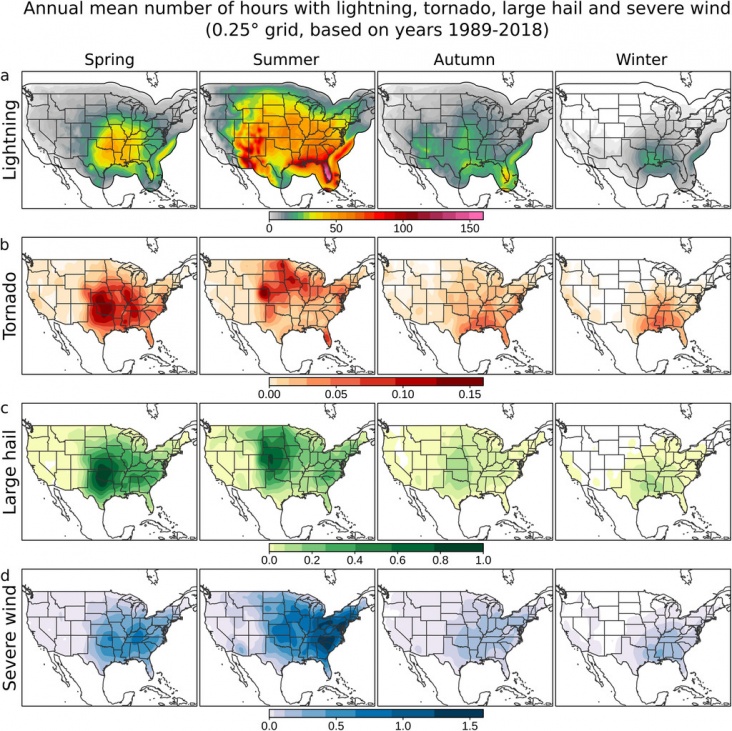
Annual mean number of hours with (a) lightning, (b) tornadoes, (c) large hail, and (d) severe wind within 0.25° boxes with a 1.25° ×1.25° spatial smoother over the United States for years 1989–2018. Duplicated records (more than one report of the same type occurring in the same box and date) were not taken into account.
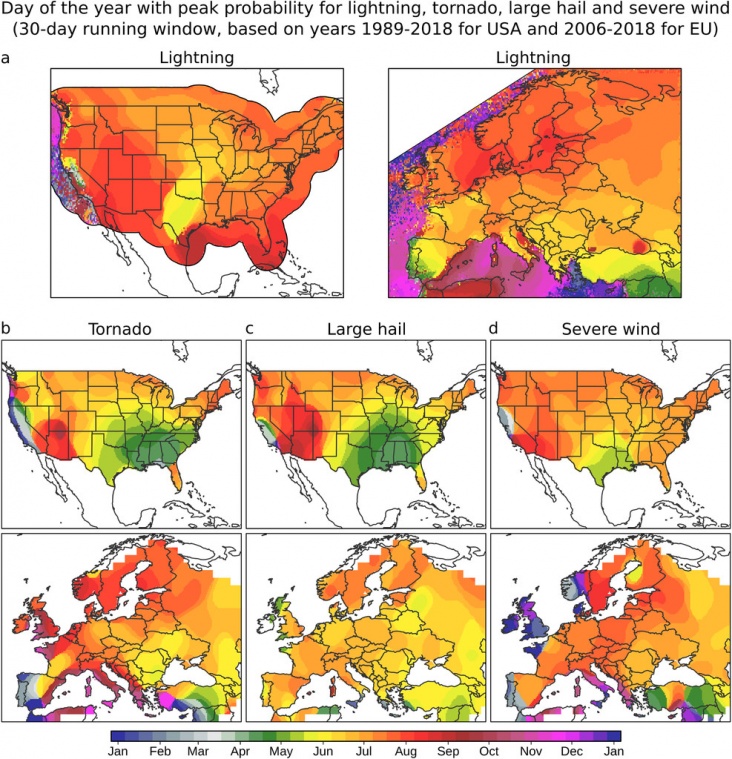
Day of the year with peak probability for (a) lightning, (b) tornados, (c) large hail, and (d) severe wind over the United States (1989–2018) and Europe (2006–18), derived from a 30-day running window over hourly resolution. Data are presented in 0.25° boxes with 1.25° × 1.25° spatial smoother based on circular statistics. Duplicated records (more than one report of the same type occurring in the same box and date) were not taken into account.
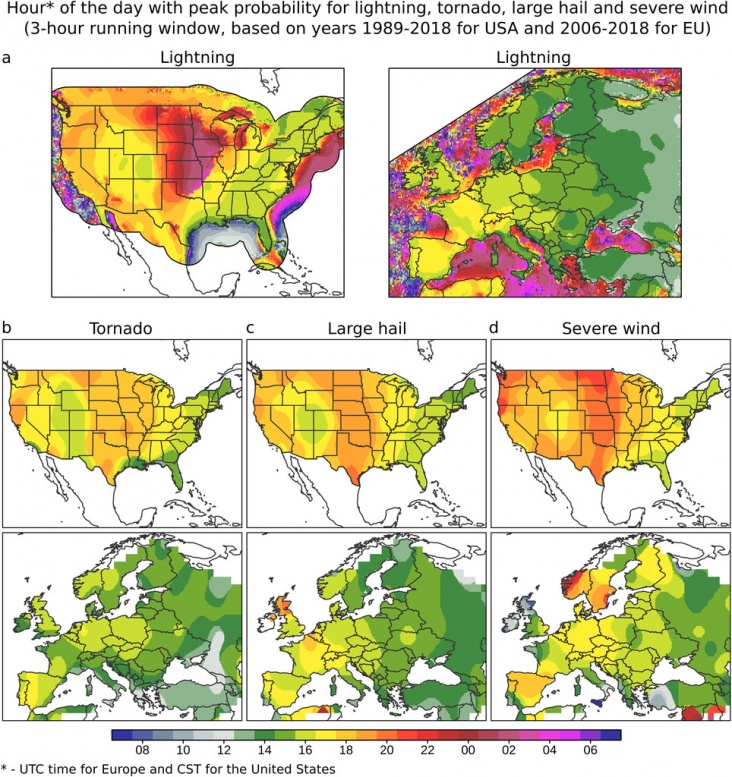
Hour of the day with peak probability for (a) lightning, (b) tornadoes, (c) large hail, and (d) severe wind over the United States (1989–2018) and Europe (2006–18), derived from a 3-h running window (UTC for Europe and CST for the United States). Data are presented in 0.25° boxes with a 1.25° × 1.25° spatial smoother based on circular statistics. Duplicated records (more than one report of the same type occurring in the same box and date) were not taken into account.
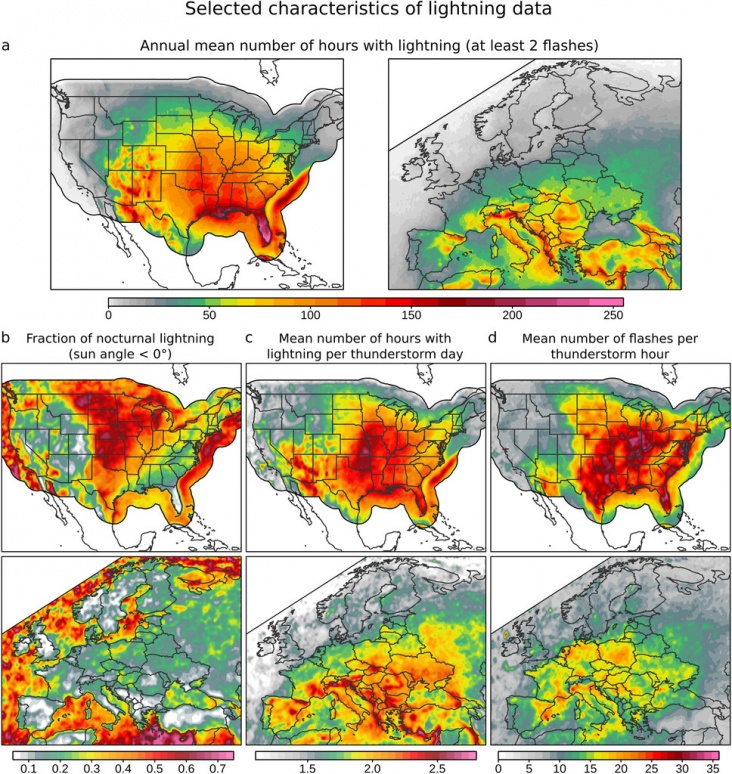
(a) Annual mean number of hours with lightning, (b) fraction of nocturnal lightning, (c) mean number of hours with lightning per thunderstorm day, and (d) mean number of flashes per thunderstorm hour over the United States (1989–2018) and Europe (2006–18). Data are presented in 0.25° boxes with a 0.75° × 0.75° spatial smoother. Nocturnal lightning is defined when a sun angle for a specific grid and date is below 0°.

Fraction of hours with lightning associated with (a) all reports, (b) tornadoes, (c) large hail, and (d) severe wind reports over the United States (1989–2018) and Europe (2006–18). Data are presented in 0.25° boxes with a 0.75° × 0.75° spatial smoother.

 Onderzoek naar verschil zware buien Europa & VS


