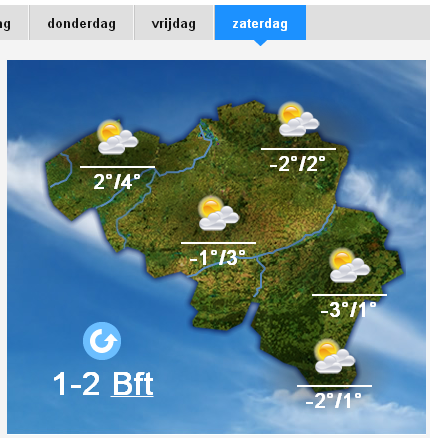
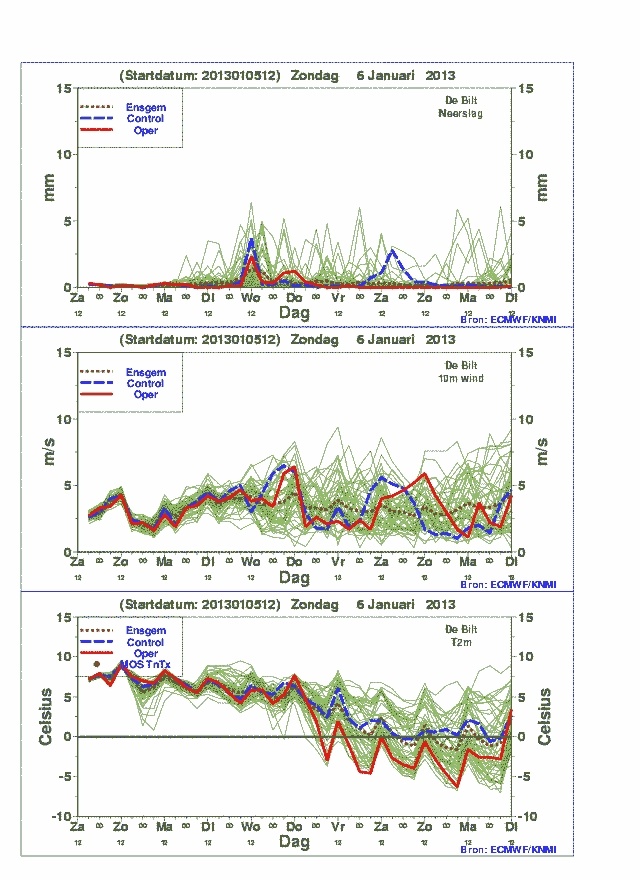
Er zijn bij EC een aantal dagen waar de temperatuur onder nul verwacht wordt ( zie hieronder). echter daarna gaan de temperaturen weer omhoog.
Wat het zal worden... daar komen we vanzelf achter maar het kan natuurlijk beide kanten op
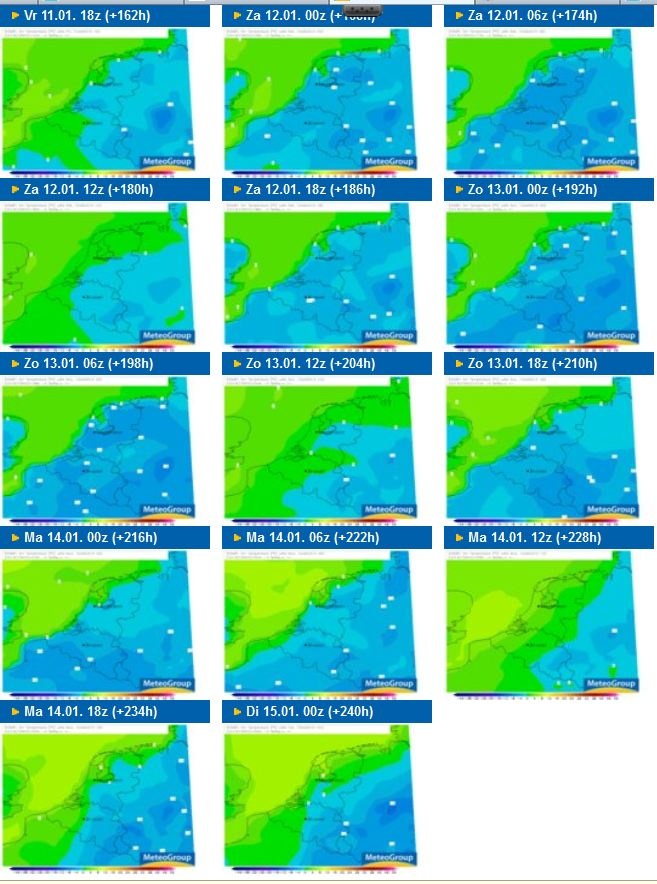
| Gewijzigd: 5 januari 2013, 12:44 uur, door Ben47
(Van theweathercentre.blogspot.com http://theweathercentre.blogspot.nl/2013/01/complete-polar-vortex-breakdown-likely.html?m=1 in het engels, maar wel duidelijk stukje )
> Complete Polar Vortex Breakdown Likely> I have been saying that the polar vortex is looking unstable, that it will sustain heavy damage, but I am now putting out the call that the polar vortex will suffer a breakdown in coming weeks.> > A 50mb animation of temperature anomalies shows we are seeing that sudden stratospheric warming (SSW) ongoing across Canada and the Arctic at this time. This comes after a previous SSW in the opening days of December. But I want to point something out. Watch the last few frames of this animation. See how that warming starts to propagate towards Japan? This could be a second warming that may strike as the current warming is ongoing. Based on how the Japanese warming cell's contour lines are expanding northeast towards the ongoing SSW, I see reason to believe this Japanese cell of warming may also move towards the Arctic and strengthen the ongoing SSW.
> Here's what I want to watch as far as model forecasts go. I am staying with the ECMWF model today out of confidence over the GFS, and because it displays information better than the GFS. Let's start with the far upper stratosphere.> > This is the 1 millibar forecast for the stratosphere over the Northern Hemisphere. The US is on the left side of the image; you can make out the shape of Alaska in dark blue. I want to point out the main attraction, the big red blot over Europe. This is the warm air from the SSW. It is doing significant damage to the polar vortex, as I went back a few forecast timeframes and found significant weakening with every 24 hour image. This confirms my theory that the polar vortex will most likely collapse in the upper stratosphere first, if there is a stratosphere collapse to be had.> I'll show these next two images together due to their similarities.> > The top image is the pressure and temperature forecast at 20 millibars, and the bottom image has the 50 millibar forecast. We want to pay close attention to the pressure lines here. Both images show two areas where there are multiple enclosed circles and/or ovals. These are daughter polar vortices. They signify that the main polar vortex has split and made multiple daughter cells. In both images, one vortex is over Canada and the other covers Eurasia. The reason these two images are significant is because the vortices are so far apart, and the split is so massive that I find it hard to believe the polar vortex can fully recover from this. The vortex is on its knees at this point- one more good SSW and collapse of multiple stratospheric levels of the polar vortex appears probable.> > > The last two images to show involve potential vorticity, or PV. In areas of raised PV, low pressure systems are commonly found, in this case the polar vortex (vortices). The top image shows presumably the PV values for the middle of the stratosphere, while the second image shows PV values for the upper stratosphere. Let's analyze the upper stratospheric image first (bottom image). We see two areas of slightly raised PV, indicating two daughter polar vortices. But they are so weak that they don't even constitue themselves to be fully-functioning polar vortices. This is what I call a good collapse of the polar vortex.> As for the top image in the mid-stratosphere, we see one compact vortex and one elongated vortex. The compact vortex is placed in Canada, meaning very cold conditions can be expected in that nation come late January-early February. The elongated polar vortex is the superior one here, but is gradually weakening per review of multiple forecast hours at this same stratospheric level. I believe weakening should continue with both polar vortices, seeing as even lower PV values are trying to funnel in the space between the two vortices. If that happens, the chances of reconciliation between the two vortices becomes lower, the chances of a collapse are raised.> The last image to show is a zonal wind forecast for Day 10, the same forecast time as the other forecast images. Here, we see three items of interest: 1) the oranges and reds in the middle of the image, 2) the blues in the right corner of the image, and 3) a finger of blues between the numbers 30 and 100 on the far left side of the image. (1): The oranges and reds suggest winds in the stratosphere that are favorable for polar vortex formation and sustainment. The winds in the stratosphere are working to hold the vortex together in the areas where there are oranges and reds. The warmer the color, the more favorable the winds are to polar vortex sustainment. This spread of oranges used to cover the entire image, but has now eroded in the face of our next item of interest.> (2): There is a large body of blues in the upper right hand corner of the image. This signifies winds that are working against formation of the polar vortex. These unfavorable winds form when a sudden stratospheric warming occurs, as the entire purpose of the SSW is to disrupt favorable polar vortex winds and insert unfavorable winds in its place. These blues have been eroding as time goes on from Day 7 to Day 10 forecast time period, but the polar vortex favorable winds have also been eroding, meaning the potential breakdown's chances are on the rise. (3): That finger of blues between the 30 millibar area and 100 millibar area shows yet another wind-based phenomenon in the stratosphere called the Quasi-Biennial Oscillation, or QBO. In a negative QBO, one encounters winds that are unfavorable to sustainment of the polar vortex, while the positive QBO brings about favorable polar vortex winds. Considering that finger of blues exists in the regions mentioned, I find a negative QBO to be in existence, another piece of the puzzle detrimental to the polar vortex. In summary, the polar vortex is definitely taking multiple hits and will experience collapse in the upper stratosphere if these forecasts verify. If the split in the polar vortex continues and even strengthens, we could see a collapse in the middle and lower stratosphere later on in January, which would then make for a cold February. I will discuss that at a later date. Andrew Andrew at 3:47 PM Share
Reactie aan de grond van deze ontwikkeling zien we, mijns insziens, nu op gang komen. De gevolgen kunnen behoorlijk zijn, en een paar weken aanhouden. Nu gaat de Polar vortex volgens de verwachtingen zich opsplitsen in drie delen. Dit lijkt een complete opsplitsing te gaan worden. De ligging van de afgesplitste delen en de mogelijke reactie aan de grond kan resulteren in ijskoud winterweer. Komende week worden de kaarten hieromtrent geschud, maar de potentie voor winterweer is er, zoals ook door onder andere Calliep is aangedragen. | Gewijzigd: 5 januari 2013, 13:23 uur, door Ben47
http://www.telegraaf.nl/binnenland/21199204/__Winter_in_aantocht__.html Zou je dr gaarne even op willen letten dat hier geen nieuwslinks worden geplaatst...die posten de medewerkers namelijk mocht 1 van ons het over het hoofd zien...dan kan je ons een pb sturen met de link...overigens heb ik dit bericht al gezet in de juiste topic....en hier een melding van gemaakt...dus even lezen graag eer je wat plaatst>>>>>>
vandaag, 10:40 uur
Woonplaats: Bovensmilde (drenthe)
Berichten: 1662
Voor de liefhebber;) http://www.onweer-online.nl/forum/topic/34229/berichtgeving-winter-2012-2013/381021/#message381021 stukje telegraaf...wil je het nieuws volgen kan dat in die topic...deze topic is enkel en alleen voor discussies
Mvg Tatanka | Gewijzigd: 5 januari 2013, 12:42 uur, door Tatanka
Stralingsvorst is a.g.v. de nabijheid van een hoog in alle clusters niet uitgesloten wat koudere nachten geeft.
52 leden
6 clusters
Onderverdeling in Cluster en Aantal leden
1: 13 Invloed van hoog boven Azoren tot boven ons land. W-NW tot windstil. Mogelijk stralingsvorst. Nederland/België ligt buiten -6 graden op 850hPa (1500m hoogte).
2: 14 (inclusief Oper en Control) Invloed hoog boven Scandinavië tot boven ons land N-NO tot windstil. Nederland en Begië liggen binnen de -6 graden op 850hPa (1500m hoogte).
3: 9 Overgangsgebied tussen Hoog Scandinavië en hoog Azoren met soms een laag boven Oost-Europa. Wind variabel van ZO tot NW. Nederland en Begië liggen net buiten of net binnen de -6 graden op 850hPa (1500m hoogte).
4: 8 Hoog overwegend ten westen van onze streken met overwegend NW tot NO wind. Nederland en Begië liggen net buiten of net binnen de -6 graden op 850hPa (1500m hoogte).
5: 6 Hoog nabij onze streken, wind variabel, Nederland en Begië liggen net buiten of net binnen de -6 graden op 850hPa (1500m hoogte).
6: 2 Hoog boven onze streken. Windstil/variabel. Stralingsvorst. Nederland en Begië liggen ver buiten de -6 graden op 850hPa (1500m hoogte).
Overeenkomstig tijdstip (gele lijn) in de EC-pluim van 0UTC vandaag.
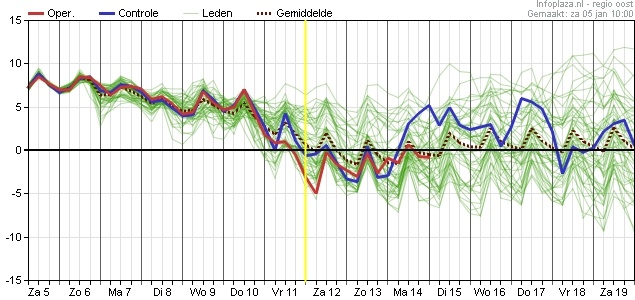 | Gewijzigd: 5 januari 2013, 15:49 uur, door Ben47
....
Mooi verhaal Ben! Erg handig om zo te zien hoe de precieze verdeling is. Goed om te horen dat de grootste cluster voor de hoge druk boven Scandinavië gaat. Echter is het toch een beetje verontrustend om te zien dat bijna evenveel leden 'gewoon' voor de westelijke stroming gaan (cluster 1).
Hoop dat de komende dagen stilaan wat meer leden kiezen voor cluster 2! Er zullen immers de komende dagen enkele clusters moeten gaan afvallen gezien het feit dat de onzekerheid en de spreiding niet zo groot kan blijven.
Hoop dat de komende dagen stilaan wat meer leden kiezen voor cluster 2! Er zullen immers de komende dagen enkele clusters moeten gaan afvallen gezien het feit dat de onzekerheid en de spreiding niet zo groot kan blijven.Graag gedaan. Benieuwd hoe de 12UTC run er voor datzelfde moment eruit gaat zien. Overigens is cluster 1 geen onvervalste strakke west circulatie. De isobaren liggen bij het ene lid in cluster 1 zeer ver uiteen en bij een ander lid uit cluster 1 komt er een depressie over de Noordzee langs.
Ik vind het nog niet overtuigend genoeg alemaal, ik moet het eerst nog alemaal eens zien, een paar dagen afwachten of de kou wel daadwerkelijk komt.
Zelf ben ik bang dat het uitdraait op kwakkel de kwak.
Kijk wel naar de oper.
| Gewijzigd: 5 januari 2013, 17:59 uur, door pakkie
Ik vind het nog niet overtuigend genoeg alemaal, ik moet het eerst nog alemaal eens zien, een paar dagen afwachten of de kou wel daadwerkelijk komt.
Zelf ben ik bang dat het uitdraait op kwakkel de kwak. Waar kijk je precies naar voor dat oordeel? Als je naar de kaarten kijkt, dat is slechts gebaseerd op 1 van de tig leden per tijdstip.
De run is niet zo waardeloos maar wel valt weer te zien dat de kou alweer naar voren word geschoven | Gewijzigd: 5 januari 2013, 20:06 uur, door Marga
wat een fantastische run van ec eerst een korte vorstperiode en dan voor eventjes zachter en dan een enorme noordstroming recht van de noordpool met een blokkade boven groenland
Berichten samengevoegd door Ben47
Geduld is erg belangrijk, en alles moet binnen de betrouwbare termijn vallen. Dan ga ik pas juichen.
Maar gezien ik zondag 13 januari naar Lapland vertrek, kan de winter bij mij al niet meer kapot.
| Gewijzigd: 5 januari 2013, 21:03 uur, door Ben47
Mijn chase gebied: Arnhem-midden Limburg en van Den Bosch tot Kleve/Emmerich/Goch en verder Duitsland in.
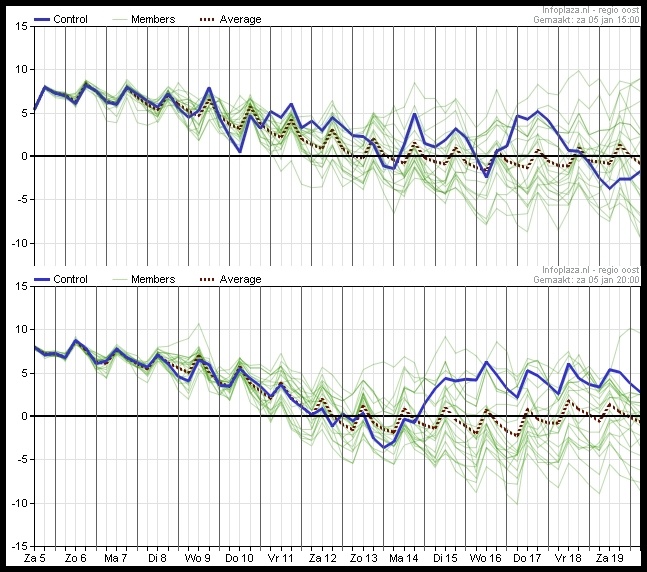 | Gewijzigd: 5 januari 2013, 21:36 uur, door Ben47
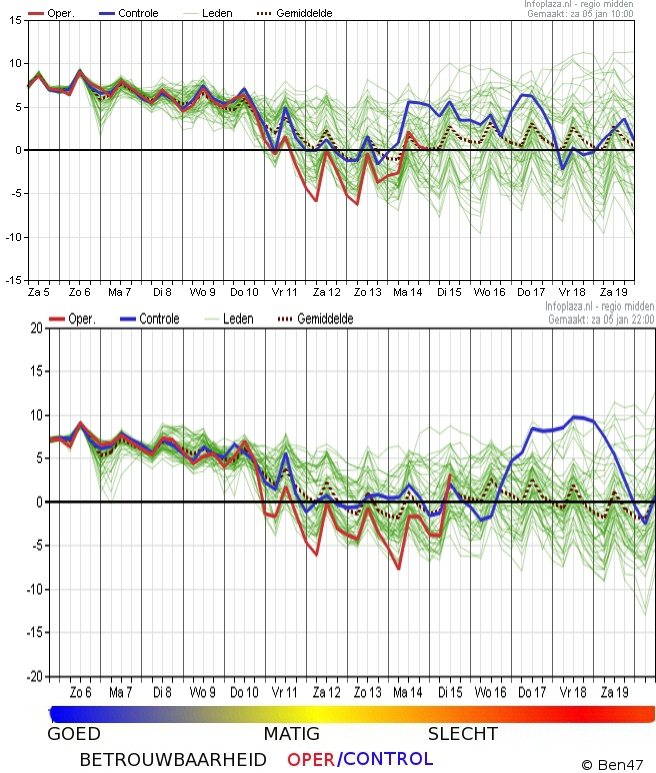
Ook de 52 EC-kaarten voor zaterdag 12 januari 0UTC laten vaak een hoog ten noorden en een laag ten zuiden tot oosten van onze streken liggen.
De 52 kaarten zijn in slechts 3 clusters opgedeeld (was bij de run van 0UTC nog 6 clusters)
Cluster 1 kent 20 leden (incl oper en control) en gaat voor een hoog boven Scandinavië.
Cluster 3 heeft 15 leden en daarvan zijn er veel met ook een hoog boven scandinavië.
Cluster 2 heeft 17 leden, waarbij een luchtdrukverdeling overwegend een west tot NW stroming bestaat.
Kortom, de luchtdrukverdeling per run van 12UTC is t.o.v. de run van 0UTC verbeterd voor kouder weer per 12 januari 0UTC.

 Winterverwachting 2012 --- 2013 + Discussie (Deel 3)


